Reading notes from 2017; technical explanations revised November 17, 2026. Architecture and scale observations refer to the source period.
Follow a request across services
A trace groups the work caused by one request. Each service records spans for its operations and passes trace context to downstream calls. That lets an engineer distinguish a slow handler from a slow dependency, rather than comparing unrelated log lines.
The Uber account describes a move toward collecting spans from distributed services. The diagram below is a historical Jaeger architecture; the storage and deployment choices should be read in that context.
Collection and sampling are separate decisions
Pushing spans to a collector describes how telemetry moves. Sampling determines which requests are retained. Neither guarantees that every span arrives: buffering, process crashes, overload, and missing context propagation can leave incomplete traces.
For an illustrative checkout request, I would look for a root HTTP span, a payment RPC span, and a database span. Their parent relationships matter as much as their durations. A database operation missing its parent can make an apparently complete trace misleading.
Operational questions
Measure dropped spans and collector backlog alongside request latency. Bound telemetry buffering so that an observability failure does not exhaust the application’s memory. Jaeger is the tracing system here; Tornado is a Python web framework, and TChannel is an RPC protocol. They are not interchangeable tracing components.
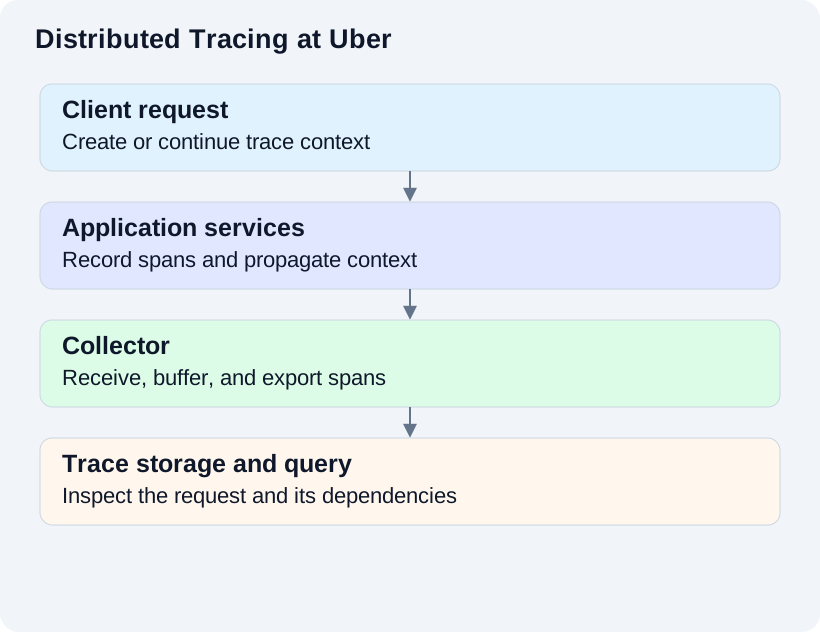
Conceptual illustration; labels describe responsibilities, not a deployment specification.

Historical Jaeger collection and storage architecture. Historical source figure; attribution and context are in References.