William Chen’s talk about Aladdin Wealth connects large-scale analytics with a concrete design problem: how much of a computational graph must be evaluated to answer a particular request? The figures in the title describe the talk’s period, not a current BlackRock capacity claim.
Daily and on-demand work
The source describes nightly analysis of more than 15 million portfolios and a separate daytime API workload. Its lessons include trimming computation graphs, choosing multiple data representations, using open source, and considering different dimensions of modularity. Source and transcript.
A smaller computational graph
Consider this illustrative dependency graph. A request for one portfolio risk result should evaluate the required dependencies, not every possible report supported by the platform. Shared inputs can be reused only when their identity and validity rules match.
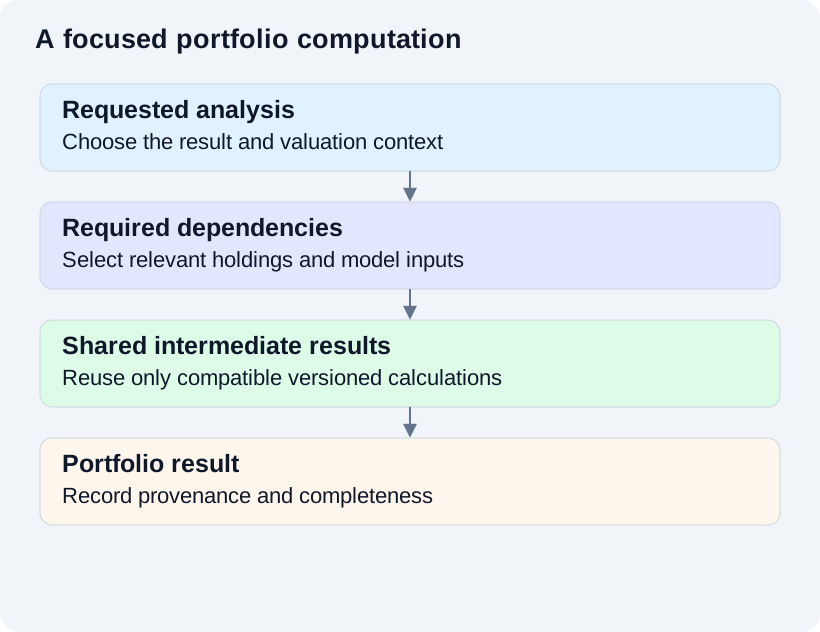
Conceptual illustration; labels describe responsibilities, not a deployment specification.
For example, two analyses may share market inputs but differ in holdings, valuation time, or model version. A cache keyed only by a portfolio identifier could return an answer computed under the wrong assumptions. A reusable intermediate needs an explicit contract.
Represent data for its access patterns
A representation suited to ingesting holdings may be awkward for a large vectorized calculation. Another representation may support interactive lookup. Multiple representations can be justified when their read paths differ, but each adds synchronization and lineage work.
The design question is which representation is authoritative, how derived views are rebuilt, and how a consumer detects an incomplete update. This is more precise than listing database products without establishing their role in the source system.
Modularity has several dimensions
A module can isolate a business calculation, a data interface, or a deployment responsibility. Those boundaries do not always coincide. Splitting every calculation into a remote service, for instance, could add serialization and network work along the critical path.
I would review the computation graph alongside the service graph. Measure duplicate calculation, cache validity, tail latency, and the time required to recover after partial failure. Distinguish a successful transport response from a complete analysis.
Apply the lesson to another domain
The same questions arise in recommendation scoring and feature computation: which inputs determine the result, which work can be shared, and which version must be recorded? See Chronon’s training and serving feature contracts for a related data-management problem.